Potash is the most concentrated of the big fertilizer markets. A handful of countries mine almost all of it, and a handful of companies run those mines. If you buy potash, you are almost always buying from one of a few producing regions, either directly or through a trader.
This page maps those potash fertilizer manufacturers: a verified sample of MOP and SOP producers, mine output by country from the U.S. Geological Survey, 2024 trade data, price benchmarks, and the questions buyers should ask. Both tables can be searched, filtered and downloaded.
It is a research resource that we check record by record, not a complete list of every potash company, and every figure on it is sourced.

The global potash industry
Potassium is an essential plant nutrient with no substitute, as the USGS puts it. Almost all of it comes from ancient salt deposits, either mined underground or dissolved and pumped to the surface, plus brines from places such as the Dead Sea and the salt flats of Chile and China.
The USGS estimates world potash mine production at about 49 million tonnes of K2O in 2025, up from 46.7 million in 2024. World consumption of potash in fertilizer was about 41.6 million tonnes, and the agency expects it to reach 45.3 million tonnes in 2029.
Capacity is growing faster than demand. The USGS puts world capacity at 66.1 million tonnes of K2O in 2025, rising to 77.4 million by 2029, mostly from new mines and expansions in Laos and Russia. New mines in Belarus, Brazil, Canada, Ethiopia, Morocco and Spain are planned after 2029.

| Country | Mine production 2024 (kt K2O) | 2025 estimate (kt K2O) |
|---|---|---|
| Canada | 14,400 | 15,000 |
| Russia | 10,000 | 10,000 |
| China | 6,300 | 6,300 |
| Belarus | 5,000 | 6,000 |
| Germany | 2,500 | 3,000 |
| Laos | 2,400 | 2,400 |
| Israel | 2,260 | 2,000 |
| Jordan | 1,730 | 1,800 |
| Chile | 564 | 600 |
| United States | 410 | 500 |
| Spain | 489 | 450 |
| World total (rounded) | 46,700 | 49,000 |
A quick word on units. Potash is measured in K2O equivalent. A tonne of standard MOP holds about 0.6 tonnes of K2O, so 15 million tonnes of K2O from Canada means roughly 25 million tonnes of actual product.
Types of potash fertilizer
| Product | Typical K2O | Other nutrients | When buyers choose it |
|---|---|---|---|
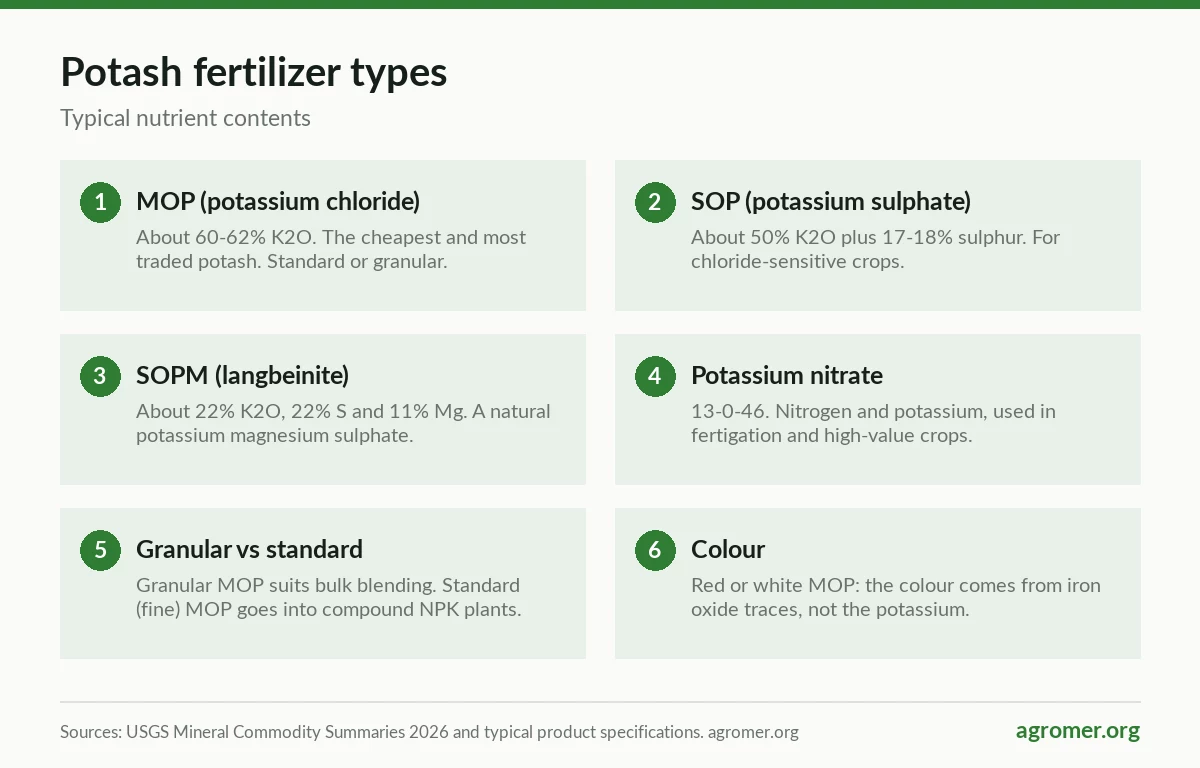
| MOP (muriate of potash, potassium chloride) | 60 to 62% | Chloride | The standard, lowest-cost potash for most field crops |
| SOP (sulphate of potash, potassium sulphate) | About 50% | 17 to 18% sulphur | Chloride-sensitive crops such as tobacco, potatoes and some fruit |
| SOPM (langbeinite) | About 22% | 22% sulphur, 11% magnesium | Where magnesium and sulphur are also needed |
| Potassium nitrate | 46% | 13% nitrogen | Fertigation and high-value horticulture |
MOP comes as standard (fine) material, mainly for compound NPK plants, and granular material for bulk blending and direct application. It can be red or white. The red colour comes from traces of iron oxide, not from a difference in potassium.
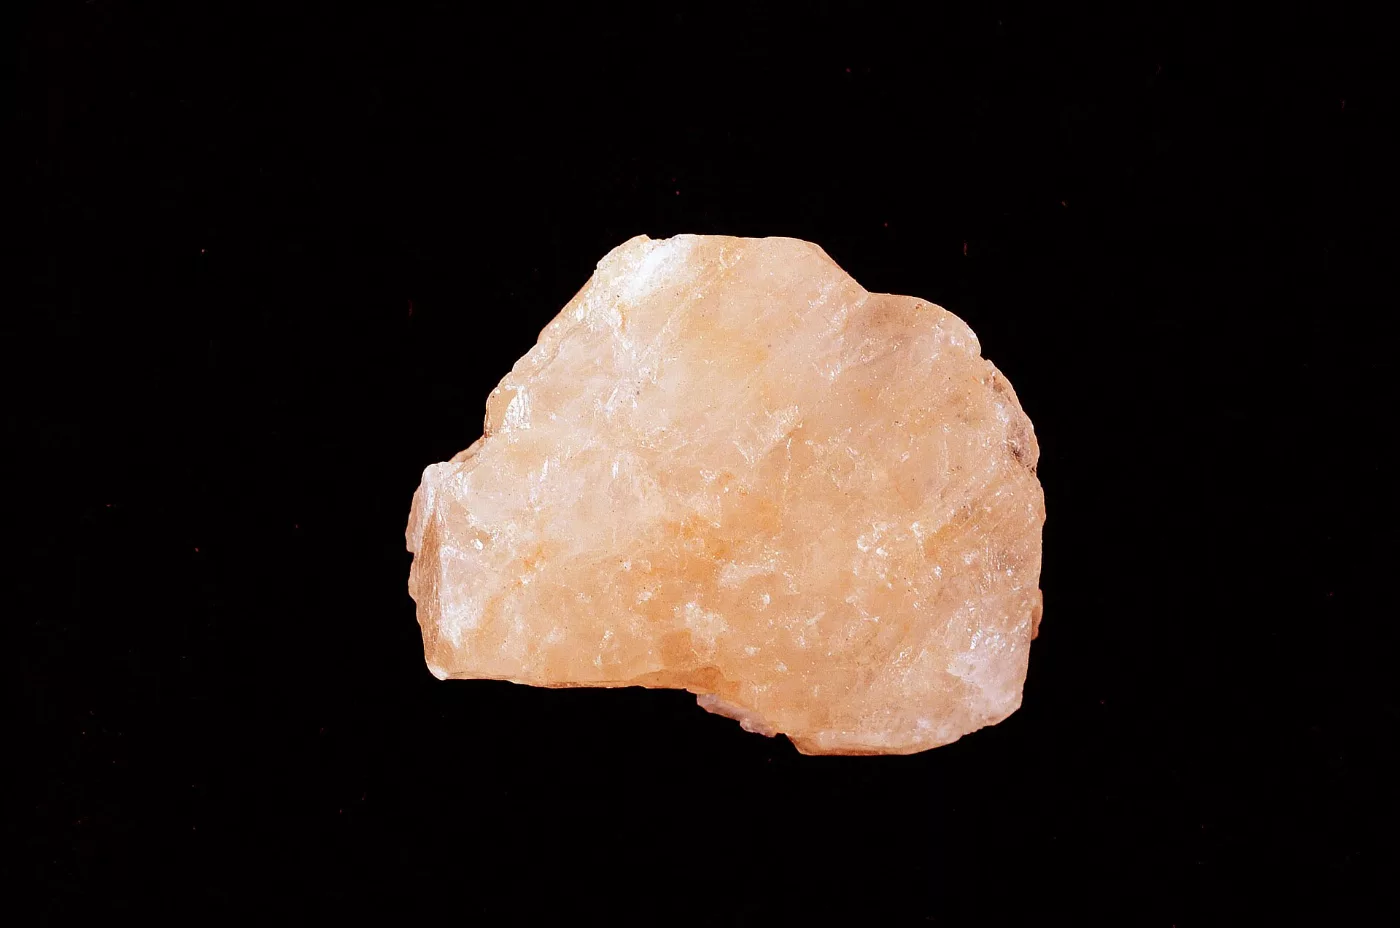
For the basics, read what is potash and our guide to MOP fertilizer.
How potash is mined and processed
There are three main routes:
- Conventional underground mining of sylvinite ore, which is then crushed and separated by flotation or dissolution and recrystallisation. This is how most Canadian, Russian, Belarusian and German potash is produced.
- Solution mining, where water is pumped into the deposit and the potash-rich brine is brought back up and crystallised.
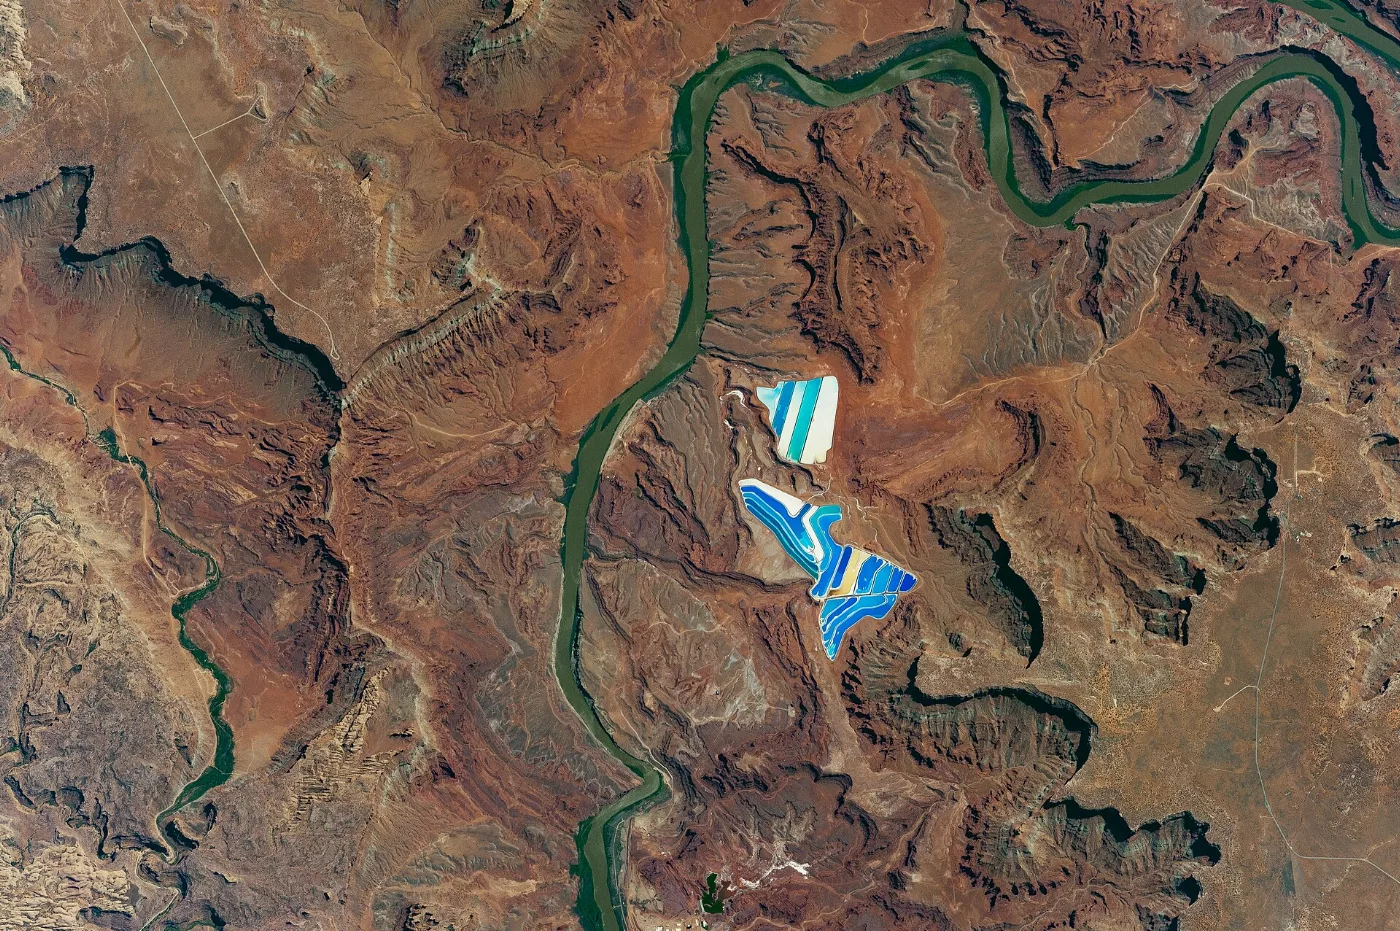
- Brine evaporation, using solar ponds at the Dead Sea, in the Atacama in Chile, in Qinghai in China and at the Great Salt Lake in the United States.
SOP is made either from natural brines and minerals or by reacting MOP with sulphuric acid. Production is smaller and more scattered, and much of it is used close to where it is made.
Search the potash manufacturers database
The table below lists potash producers we confirmed in October 2026, on the company’s official website or, where the website blocks automated checks, on Wikipedia. “Products confirmed” shows only what that source states.
| Company | Country | Region | Products confirmed | Country MOP exports 2024 (kt) | Official website | Verified via (Oct 2026) |
|---|---|---|---|---|---|---|
| Belaruskali | Belarus | Europe and Central Asia | Potash fertilizers | 3,606* | belaruskali.by | Wikipedia · check sanctions |
| Nutrien | Canada | North America | Potash, nitrogen, phosphate | 22,878 | nutrien.com | Official website |
| SQM | Chile | Latin America | Potassium chloride, potassium nitrate | 501 | sqm.com | Wikipedia |
| K+S | Germany | Europe | Potash fertilizers | 3,243 | kpluss.com | Wikipedia |
| ICL Group | Israel | Middle East | Potash, specialty fertilizers | 3,093* | icl-group.com | Official website |
| Arab Potash Company | Jordan | Middle East | Potash (Dead Sea) | 2,232* | arabpotash.com | Official website |
| Uralkali | Russia | Europe and Central Asia | Potash fertilizers | 15,502* | uralkali.com | Wikipedia · check sanctions |
| EuroChem | Switzerland (mines in Russia) | Europe and Central Asia | Potash, nitrogen, phosphates, NPK | eurochemgroup.com | Wikipedia · check sanctions | |
| Compass Minerals | United States | North America | Sulphate of potash (SOP) | 4,562** | compassminerals.com | Wikipedia |
| Intrepid Potash | United States | North America | Potash | 4,562** | intrepidpotash.com | Official website |
| The Mosaic Company | United States | North America | Potash, phosphate | 4,562** | mosaicco.com | Official website |
Potash producers we confirmed in October 2026, on the company's official website or, where the website blocks automated checks, on Wikipedia (linked in the last column). "Products confirmed" lists only what that source states. This is a verified sample, not a complete list, and inclusion does not mean Agromer represents the company. Russian and Belarusian producers: check the sanctions rules that apply to you. Country export figures: UN Comtrade, HS 310420 (potassium chloride, MOP) and HS 310430 (potassium sulphate, SOP), 2024; blank means not reported. *Russia, Belarus, Israel, Jordan and Laos did not report 2024 potash exports; their figures are the imports partner countries reported from them, a minimum (Belarus in particular is heavily understated). **The USA export figure is far above the roughly 150,000 tonnes K2O of US potash exports reported by the USGS for 2024 and probably includes re-exports.
Potash trade by country, 2024
This table combines UN Comtrade MOP and SOP trade with USGS mine production for every country that reported data.
| Country | MOP exports 2024 (kt) | SOP exports 2024 (kt) | Avg MOP export value 2024 ($/t) | MOP imports 2024 (kt) | SOP imports 2024 (kt) | Avg MOP import value 2024 ($/t) | Potash mine output 2025e (kt K2O) |
|---|---|---|---|---|---|---|---|
| Algeria | 7.1 | 53 | |||||
| Angola | 0.1 | 12 | 0.5 | ||||
| Antigua and Barbuda | <0.1 | <0.1 | |||||
| Argentina | value $33.5M, no tonnage | 7.7 | |||||
| Armenia | <0.1 | 0.1 | value $0.1M, no tonnage | 0.4 | |||
| Australia | 1 | 0.1 | 538 | 92 | 386 | ||
| Austria | 0.6 | 20 | 41 | 14 | |||
| Azerbaijan | value $1.6M, no tonnage | value $3.0M, no tonnage | |||||
| Bahamas | <0.1 | <0.1 | |||||
| Bahrain | 2.1 | <0.1 | |||||
| Barbados | <0.1 | <0.1 | |||||
| Belarus | 3,606* | 6,000 | |||||
| Belgium | 284 | 363 | 1,086 | 337 | |||
| Belize | 0.3 | 0.2 | |||||
| Benin | <0.1 | ||||||
| Bermuda | <0.1 | <0.1 | |||||
| Bhutan | |||||||
| Bolivia (Plurinational State of) | 52 | 4.4 | 0.2 | ||||
| Bosnia Herzegovina | <0.1 | 4 | <0.1 | ||||
| Botswana | <0.1 | 0.1 | |||||
| Brazil | 54 | 0.6 | value $4,241.5M, no tonnage | 55 | 300 | ||
| Brunei Darussalam | <0.1 | <0.1 | |||||
| Bulgaria | 0.7 | <0.1 | 21 | 0.9 | |||
| Burkina Faso | |||||||
| Burundi | |||||||
| Cabo Verde | <0.1 | <0.1 | |||||
| Cambodia | <0.1 | 5 | 1.1 | ||||
| Cameroon | |||||||
| Canada | 22,878 | 25 | 253 | 5.3 | 8.3 | 15,000 | |
| Cayman Isds | <0.1 | ||||||
| Chile | 501 | 0.7 | 227 | 28 | value $13.6M, no tonnage | 600 | |
| China | 120 | 16 | 337 | 12,778 | 25 | 295 | 6,300 |
| China, Hong Kong SAR | <0.1 | <0.1 | <0.1 | ||||
| Colombia | 4.5 | 0.6 | 603 | 29 | 322 | ||
| Comoros | |||||||
| Congo | 0.1 | 4.8 | <0.1 | ||||
| Costa Rica | 3.1 | 0.3 | 157 | 8.6 | 291 | ||
| Croatia | 3.6 | 0.2 | 46 | 2.3 | |||
| Cyprus | <0.1 | 0.1 | 0.2 | ||||
| Czechia | 5 | 1.1 | 107 | 4.1 | 454 | ||
| Côte d'Ivoire | 4.9 | <0.1 | 118 | 1.9 | 365 | ||
| Dem. Rep. of the Congo | 3.6 | <0.1 | |||||
| Denmark | 0.3 | <0.1 | 41 | 3.2 | |||
| Djibouti | |||||||
| Dominican Rep. | 13 | 5.2 | |||||
| Ecuador | 0.4 | 0.2 | value $68.0M, no tonnage | 19 | |||
| Egypt | 0.1 | value $117.5M, no tonnage | 285 | value $32.2M, no tonnage | 365 | ||
| El Salvador | 3 | 13 | value $0.1M, no tonnage | ||||
| Estonia | <0.1 | <0.1 | 7.6 | 0.3 | |||
| Eswatini | |||||||
| Ethiopia | |||||||
| Fiji | value $1.6M, no tonnage | 0.1 | |||||
| Finland | <0.1 | 4.7 | |||||
| France | 12 | 7.1 | value $192.3M, no tonnage | value $29.0M, no tonnage | |||
| Gabon | |||||||
| Georgia | 1.1 | 0.6 | |||||
| Germany | 3,243 | 339 | 127 | 9.4 | 334 | 3,000 | |
| Ghana | 18 | 2.1 | |||||
| Greece | <0.1 | 0.6 | value $18.7M, no tonnage | 30 | |||
| Grenada | <0.1 | ||||||
| Guatemala | 1.8 | <0.1 | 112 | 2.8 | 328 | ||
| Guyana | <0.1 | 1.8 | |||||
| Honduras | 15 | 0.3 | 100 | 2.2 | 326 | ||
| Hungary | 14 | 0.8 | 61 | 4.9 | |||
| Iceland | <0.1 | <0.1 | |||||
| India | 19 | 1.4 | value $1,117.3M, no tonnage | 73 | |||
| Indonesia | 5.5 | 18 | value $1,007.5M, no tonnage | value $6.3M, no tonnage | |||
| Iran | |||||||
| Iraq | 2.5 | <0.1 | |||||
| Ireland | 0.3 | <0.1 | 138 | 2.3 | 395 | ||
| Israel | 3,093* | 0.5 | 4.5 | 2,000 | |||
| Italy | 9.3 | 10 | value $115.6M, no tonnage | value $29.6M, no tonnage | |||
| Jamaica | <0.1 | <0.1 | |||||
| Japan | 0.9 | <0.1 | 342 | 41 | 422 | ||
| Jordan | 2,232* | 4.4 | 0.1 | 3.9 | 1,800 | ||
| Kazakhstan | 42 | <0.1 | value $2.6M, no tonnage | 2.5 | |||
| Kenya | 9 | 1.6 | 16 | 22 | |||
| Kuwait | 2 | 21 | 0.4 | ||||
| Kyrgyzstan | 0.2 | 0.1 | |||||
| Lao People's Dem. Rep. | 2,682* | 2,400 | |||||
| Latvia | 8 | 1.7 | 67 | 0.6 | |||
| Lebanon | 0.2 | 3.7 | |||||
| Lesotho | <0.1 | <0.1 | |||||
| Liberia | 1.7 | ||||||
| Lithuania | 10 | 1.7 | 116 | 3.3 | 324 | ||
| Luxembourg | 0.2 | <0.1 | 0.4 | 0.3 | |||
| Madagascar | 0.2 | value $0.4M, no tonnage | |||||
| Malawi | 8.8 | 6.9 | |||||
| Malaysia | 114 | 0.2 | 391 | 1,645 | value $5.2M, no tonnage | 296 | |
| Maldives | <0.1 | <0.1 | |||||
| Mali | 14 | 26 | <0.1 | ||||
| Malta | <0.1 | ||||||
| Mauritania | <0.1 | ||||||
| Mauritius | 2.8 | 0.4 | |||||
| Mexico | 0.3 | 163 | 80 | 383 | |||
| Mongolia | |||||||
| Montenegro | <0.1 | ||||||
| Montserrat | <0.1 | ||||||
| Morocco | 0.1 | 620 | 47 | 298 | |||
| Mozambique | 2.9 | 1.3 | 3.8 | 1.3 | |||
| Myanmar | 11 | 17 | |||||
| Namibia | 8.4 | 5 | value $16.6M, no tonnage | 11 | |||
| Netherlands | 189 | 16 | 404 | 391 | 68 | 301 | |
| New Zealand | 0.1 | <0.1 | 195 | 19 | 342 | ||
| Nicaragua | 39 | 0.6 | |||||
| Niger | 0.4 | ||||||
| Nigeria | 5.1 | value $49.2M, no tonnage | |||||
| North Macedonia | 0.2 | 0.1 | |||||
| Norway | 0.2 | 0.8 | |||||
| Oman | 10 | 0.6 | value $12.0M, no tonnage | value $1.4M, no tonnage | |||
| Other Asia, nes (Taiwan) | 0.9 | 171 | 399 | 0.5 | 348 | ||
| Pakistan | 74 | 70 | |||||
| Panama | 0.4 | 0.1 | value $6.7M, no tonnage | 0.2 | |||
| Papua New Guinea | 18 | <0.1 | |||||
| Paraguay | 388 | 0.4 | 356 | ||||
| Peru | 1.8 | 0.2 | value $42.7M, no tonnage | 90 | |||
| Philippines | 5.5 | 215 | value $0.9M, no tonnage | 355 | |||
| Poland | 56 | 0.2 | 959 | 18 | 350 | ||
| Portugal | 6.1 | 1.1 | 37 | 9.1 | |||
| Qatar | 1.8 | 0.2 | |||||
| Rep. of Korea | 2.3 | value $8.7M, no tonnage | 770 | value $14.2M, no tonnage | 321 | ||
| Rep. of Moldova | 0.3 | ||||||
| Romania | 11 | <0.1 | 47 | 2.1 | |||
| Russian Federation | 15,502* | 10,000 | |||||
| Rwanda | 3.2 | <0.1 | |||||
| Saint Vincent and the Grenadines | |||||||
| Sao Tome and Principe | <0.1 | ||||||
| Saudi Arabia | 1.2 | 14 | value $23.2M, no tonnage | 23 | |||
| Senegal | 0.4 | 7.1 | 4.9 | ||||
| Serbia | 1 | <0.1 | 113 | 9.2 | 189 | ||
| Seychelles | |||||||
| Singapore | 0.4 | 7.8 | 1 | 0.2 | |||
| Slovakia | 0.5 | 0.1 | value $2.7M, no tonnage | 1.4 | |||
| Slovenia | 11 | <0.1 | 22 | 1.1 | |||
| South Africa | 22 | 13 | 430 | 121 | 281 | ||
| Spain | value $182.3M, no tonnage | 6.7 | value $36.0M, no tonnage | value $34.5M, no tonnage | 450 | ||
| Sri Lanka | value $23.3M, no tonnage | <0.1 | |||||
| State of Palestine | |||||||
| Suriname | <0.1 | ||||||
| Sweden | 0.6 | 159 | 90 | 5 | |||
| Switzerland | <0.1 | value $5.7M, no tonnage | 4 | ||||
| Tajikistan | |||||||
| Thailand | 39 | 0.4 | value $336.0M, no tonnage | 15 | |||
| Timor-Leste | |||||||
| Togo | 3 | ||||||
| Tonga | |||||||
| Trinidad and Tobago | <0.1 | value $0.5M, no tonnage | <0.1 | ||||
| Tunisia | 0.4 | <0.1 | 2 | 8.6 | |||
| Türkiye | 28 | 14 | value $75.7M, no tonnage | 24 | |||
| USA | 4,562** | 39 | 273 | 13,969 | 122 | 266 | 500 |
| Uganda | <0.1 | 5.4 | 2.5 | ||||
| Ukraine | 0.1 | value $52.7M, no tonnage | 3.4 | ||||
| United Arab Emirates | |||||||
| United Kingdom | 164 | value $0.9M, no tonnage | 251 | 326 | 12 | 374 | |
| United Rep. of Tanzania | 0.9 | 25 | 4.1 | ||||
| Uruguay | <0.1 | 136 | 0.2 | 324 | |||
| Uzbekistan | 99 | 24 | 0.5 | 1.3 | |||
| Viet Nam | |||||||
| Yemen | 0.1 | ||||||
| Zambia | 44 | 17 | |||||
| Zimbabwe | 37 | 24 |
Sources: UN Comtrade, HS 310420 (potassium chloride, MOP) and HS 310430 (potassium sulphate, SOP), reporter data for 2023 and 2024, retrieved October 2026; U.S. Geological Survey, Mineral Commodity Summaries 2026 (potash, K2O equivalent, 2025 estimates). Average values are reported value divided by reported weight (exports usually FOB, imports usually CIF), shown only for larger flows. Blank cells mean not reported. *Russia, Belarus, Israel, Jordan and Laos did not report 2024 potash exports; their figures are the imports partner countries reported from them, a minimum (Belarus in particular is heavily understated). **The USA export figure is far above the roughly 150,000 tonnes K2O of US potash exports reported by the USGS for 2024 and probably includes re-exports.
Export markets and trade flows
Canada exported 22.9 million tonnes of MOP in 2024, at an average customs value of about $253 per tonne.
Russia, Belarus, Israel, Jordan and Laos did not report their 2024 potash exports. Partner countries reported importing at least 15.5 million tonnes of MOP from Russia, 3.6 million from Belarus, 3.1 million from Israel, 2.7 million from Laos and 2.2 million from Jordan. Belarusian volumes in particular are understated by this method, because not every importing country reports the origin and tonnage of what it buys.
Germany exported 3.2 million tonnes, and Chile about 0.5 million.
On the import side, the United States took 14.0 million tonnes of MOP in 2024 and China 12.8 million. Brazil, one of the largest potash buyers, reported the value of its 2024 MOP imports ($4.24 billion) but not the tonnage. In 2023 it reported 13.4 million tonnes. India also reported value only.
SOP trade is much smaller. Reported SOP exports totalled well under one million tonnes in 2024. Much SOP is consumed in the country where it is made.
Sanctions and supply risk
Belarusian and Russian potash is a large share of world supply. Several countries and regions apply sanctions to some Belarusian and Russian companies, people, banks and transport routes. Buyers and their banks need to screen each transaction against the rules that apply to them. Our database marks these producers with a reminder, but it is not legal advice.
Potash prices
The World Bank tracks granular potassium chloride on a CFR Brazil basis.
| Period | Potassium chloride, $ per tonne |
|---|---|
| 2023 average | 383.2 |
| 2024 average | 295.1 |
| 2025 average | 347.5 |
| July to September 2026 | 383.6 |
| September 2026 | 367.5 |
For a fuller explanation of price drivers, see K2O fertilizer price.
How to choose a potash supplier
- Product: MOP or SOP, standard or granular, red or white.
- Specification: minimum K2O, particle size range, moisture and anti-caking treatment.
- Origin and producer: ask for the mine, the loading port and the producer’s name.
- Volume and timing: potash producers plan export programmes months ahead.
- Minimum quantities: these depend on the producer and route, so confirm them before you plan.
- Logistics: bulk vessel, big bags or bags, discharge port limits and storage.
- Payment and Incoterms: a secure instrument, and a clear FOB, CFR or CIF basis.
- Sanctions and compliance: screen every party, bank and vessel.
- Inspection: independent weight and quality checks at loading.
Why a potash producer database is useful
With so few producing countries, potash research is less about finding names and more about understanding which origins fit your market, your compliance rules and your freight costs. A database helps you:
- See the realistic origins for your destination.
- Check that the company named in an offer actually produces potash.
- Compare trade values and benchmarks before negotiating.
- Plan around supply risks such as sanctions and new mine start-ups.
- Prepare a clear enquiry that a producer or trader can answer quickly.
Buying potash through Agromer
Agromer has been an international commodity trader since 1985, based in Saint-Avertin, France. We supply potash, including MOP. Grade, K2O content and granulation are agreed in each contract and checked by independent inspection, such as SGS. Tell us the product, specification, quantity, packaging and destination port. You can also read our potash fertilizer supply page.
Frequently asked questions
Which countries produce the most potash fertilizer?
The USGS estimates that Canada produced 15 million tonnes of K2O in 2025, followed by Russia (10 million), China (6.3 million) and Belarus (6 million). Germany, Laos, Israel and Jordan follow.
Who are the largest potash manufacturers?
The biggest producers include Nutrien, Mosaic, Uralkali, Belaruskali, K+S, ICL, Arab Potash Company and EuroChem. SQM in Chile and Compass Minerals in the United States are important for specialty potassium products.
What is the difference between MOP and SOP?
MOP is potassium chloride with about 60% K2O. SOP is potassium sulphate with about 50% K2O plus sulphur. SOP costs more and is used for crops that are sensitive to chloride.
Why do Belarus and Russia show as minimum figures?
They did not report 2024 trade to UN Comtrade. Their exports are estimated from what importing countries reported, which misses any imports that are not reported with their origin and tonnage.
What is the price of potash today?
The World Bank benchmark for granular potassium chloride averaged $367.5 per tonne CFR Brazil in September 2026. Prices for other origins, grades and destinations differ.
Is red potash better than white potash?
No. The colour comes from traces of iron oxide. What matters is the K2O content, particle size and physical quality.
Can I download the potash manufacturers database?
Yes. Use the Download CSV button above either table to save the rows you see, along with the sources.