Ammonium sulphate is the fertilizer most buyers forget is a by-product. A large share of the world’s supply comes out of plants that were built to make something else, most often caprolactam for nylon. That makes the market unusual. Supply depends partly on the chemical and steel industries, quality depends on the source, and one country dominates exports.
This page helps buyers make sense of it. It lists a verified sample of ammonium sulphate manufacturers, 2024 trade data for every reporting country, the main grades, and what to check before you buy. Both tables can be searched and downloaded as CSV.
It is a research resource that we build and verify record by record. It is not a complete list of ammonium sulphate suppliers, and we only show details that a public source confirms.
What ammonium sulphate is
Ammonium sulphate, (NH4)2SO4, contains about 21% nitrogen and 24% sulphur. The sulphur is the main reason many farmers choose it. Crops such as oilseed rape, maize, sugarcane, rice and many vegetables need sulphur, and soils are often short of it.
It also acidifies the soil, which helps on alkaline soils and in some crops but needs managing on acid soils. The nitrogen is in ammonium form, so it is less prone to volatilisation losses than urea when applied to the surface.

Outside agriculture, ammonium sulphate is used in food processing, water treatment, fire-retardant formulations and other industrial applications. Industrial and food grades have tighter purity specifications than fertilizer grade.
Grades and product types

| Grade | Description | Typical use |
|---|---|---|
| Granular | Larger, harder particles, often 2 to 4 mm | Bulk blending and direct spreading; usually priced above standard grade |
| Crystalline (standard) | Fine crystals | Direct application, NPK granulation plants, dissolving for liquid fertilizers |
| Compacted | Crystalline material pressed into granule-sized particles | An alternative to true granular for blending |
| Industrial or technical grade | Higher purity, tighter limits on impurities | Industrial processes |
| Food grade | Meets food additive specifications | Food processing |
Particle size matters more than many buyers expect. Standard crystals do not blend well with granular urea, DAP or MOP, because different particle sizes separate during handling. If you run a blending plant, granular or compacted material is usually the right choice.
How ammonium sulphate is made
There are several routes, and the source often shows up in the product.
- Caprolactam by-product. Making caprolactam, the raw material for nylon 6, produces ammonium sulphate as a by-product. It is one of the largest sources.
- Coke-oven gas. Steel plants that make coke can recover ammonia from coke-oven gas as ammonium sulphate. In China this material is often traded under the name “steel grade” or “coking grade”.
- Other chemical processes. Some is recovered from processes such as methyl methacrylate production and from gas cleaning.
- Direct synthesis. Ammonia is reacted with sulphuric acid to make ammonium sulphate on purpose.
Because by-product supply follows the main product, ammonium sulphate output can rise or fall with nylon and steel production, not only with fertilizer demand. Colour, residual acidity and impurity levels also vary with the source.
Search the ammonium sulphate manufacturers database
The table below lists ammonium sulphate producers we confirmed in October 2026, on their official websites or, where a site blocks automated checks, on Wikipedia. “Products confirmed” shows only what the source states.
| Company | Country | Region | Products confirmed | Country ammonium sulphate exports 2024 (kt) | Official website | Verified via (Oct 2026) |
|---|---|---|---|---|---|---|
| Fertilisers and Chemicals Travancore (FACT) | India | South Asia | Ammonium sulphate | 7 | fact.co.in | Wikipedia |
| Gujarat State Fertilizers & Chemicals (GSFC) | India | South Asia | Ammonium sulphate 20.5% N | 7 | gsfclimited.com | Official website |
| Petrokimia Gresik | Indonesia | Southeast Asia | Ammonium sulphate (ZA) | 41 | petrokimia-gresik.com | Wikipedia |
| Fibrant | Netherlands | Europe | Ammonium sulfate (ASpure) | 382 | fibrant52.com | Official website |
| KuibyshevAzot | Russia | Europe and Central Asia | Crystalline and granular ammonium sulphate | 262* | kuazot.ru | Official website · check sanctions |
| AdvanSix | United States | North America | Ammonium sulfate | 470 | advansix.com | Official website |
Ammonium sulphate producers we confirmed in October 2026, on the company's official website or, where the website blocks automated checks, on Wikipedia (linked in the last column). "Products confirmed" lists only what that source states. This is a verified sample, not a complete list, and inclusion does not mean Agromer represents the company. Russian and Belarusian producers: check the sanctions rules that apply to you. Country export figures: UN Comtrade, HS 310221 (ammonium sulphate), 2024; blank means not reported. *Russia did not report 2024 trade; its export figure is the imports partner countries reported from Russia, a minimum.
We have not yet been able to verify individual Chinese producers to our standard, even though China dominates exports. We will add them as we confirm each one.
Ammonium sulphate trade by country, 2023 and 2024
This table covers every country that reported ammonium sulphate trade (HS 310221) to UN Comtrade.
| Country | Exports 2023 (kt) | Exports 2024 (kt) | Avg export value 2024 ($/t) | Imports 2023 (kt) | Imports 2024 (kt) | Avg import value 2024 ($/t) |
|---|---|---|---|---|---|---|
| Albania | 0.2 | 0.2 | ||||
| Algeria | 27 | |||||
| Angola | value $9.2M, no tonnage | 57 | ||||
| Antigua and Barbuda | <0.1 | |||||
| Argentina | 29 | value $11.3M, no tonnage | ||||
| Armenia | 0.1 | 0.2 | ||||
| Australia | value $67.9M, no tonnage | 452 | 216 | |||
| Austria | 1.6 | 3.4 | 19 | 25 | ||
| Azerbaijan | value $0.9M, no tonnage | value $0.8M, no tonnage | ||||
| Bahamas | <0.1 | <0.1 | ||||
| Bahrain | <0.1 | |||||
| Barbados | 0.4 | 0.2 | ||||
| Belgium | 933 | 1,127 | 207 | 120 | 54 | |
| Belize | 3.9 | 2 | ||||
| Bermuda | <0.1 | |||||
| Bhutan | <0.1 | |||||
| Bolivia (Plurinational State of) | 3.8 | 5.8 | ||||
| Bosnia Herzegovina | 5.5 | 3.5 | 1.2 | |||
| Botswana | 0.3 | 0.2 | ||||
| Brazil | 28 | 19 | 5,120 | value $1,081.8M, no tonnage | ||
| Brunei Darussalam | <0.1 | <0.1 | ||||
| Bulgaria | 3.6 | 2.1 | 5.8 | value $2.9M, no tonnage | ||
| Burkina Faso | <0.1 | <0.1 | ||||
| Burundi | <0.1 | |||||
| Cabo Verde | ||||||
| Cambodia | 3.8 | 8.4 | ||||
| Cameroon | 48 | |||||
| Canada | 474 | 409 | 370 | 122 | 137 | 317 |
| Chile | <0.1 | <0.1 | value $7.2M, no tonnage | value $6.1M, no tonnage | ||
| China | 13,771 | 17,124 | 149 | 0.9 | value $0.2M, no tonnage | |
| China, Hong Kong SAR | 0.2 | <0.1 | <0.1 | <0.1 | ||
| Colombia | 0.1 | 0.1 | value $42.4M, no tonnage | 176 | 205 | |
| Congo | <0.1 | |||||
| Costa Rica | 1.7 | 0.6 | 18 | 18 | ||
| Croatia | 6.4 | 14 | 19 | 9.7 | ||
| Cyprus | 0.5 | 0.4 | ||||
| Czechia | 53 | 39 | 41 | value $15.0M, no tonnage | ||
| Côte d'Ivoire | 0.2 | 2.7 | 41 | 14 | ||
| Dem. Rep. of the Congo | 0.4 | 0.6 | ||||
| Denmark | <0.1 | 38 | 53 | |||
| Djibouti | <0.1 | |||||
| Dominica | <0.1 | |||||
| Dominican Rep. | <0.1 | 68 | 82 | |||
| Ecuador | 0.5 | value $33.3M, no tonnage | value $33.1M, no tonnage | |||
| Egypt | 41 | 29 | 12 | 6.6 | ||
| El Salvador | 2.6 | 7.5 | 121 | 103 | 203 | |
| Estonia | 0.7 | <0.1 | value $4.3M, no tonnage | 4.1 | ||
| Eswatini | 0.8 | 0.8 | ||||
| Ethiopia | value $0.2M, no tonnage | |||||
| Fiji | 19 | 16 | ||||
| Finland | 96 | 92 | ||||
| France | value $4.2M, no tonnage | value $2.7M, no tonnage | value $85.5M, no tonnage | value $86.4M, no tonnage | ||
| Gabon | 4.1 | |||||
| Georgia | 1.3 | 7.8 | 0.1 | 0.1 | ||
| Germany | 236 | 272 | 222 | 203 | 200 | 262 |
| Ghana | value $9.5M, no tonnage | value $11.8M, no tonnage | ||||
| Greece | 1.7 | 2.4 | 83 | 106 | 242 | |
| Grenada | <0.1 | <0.1 | ||||
| Guatemala | 8.3 | 7.1 | 170 | 174 | 196 | |
| Guyana | 0.6 | 0.5 | ||||
| Honduras | 22 | 18 | 49 | 54 | ||
| Hungary | value $1.3M, no tonnage | 4.6 | 76 | 58 | ||
| Iceland | 0.5 | 0.6 | ||||
| India | 7.4 | 7 | value $54.1M, no tonnage | 545 | 147 | |
| Indonesia | 0.5 | 41 | 699 | 1,099 | 156 | |
| Iran | 6.6 | 4 | ||||
| Iraq | 1.7 | <0.1 | ||||
| Ireland | 0.7 | 0.6 | 53 | 67 | ||
| Israel | 14 | 17 | ||||
| Italy | 71 | value $11.1M, no tonnage | value $62.5M, no tonnage | 217 | 246 | |
| Jamaica | 8.2 | 3.2 | ||||
| Japan | 266 | 270 | 120 | 59 | 50 | |
| Jordan | 0.1 | 8.5 | 11 | |||
| Kazakhstan | 0.6 | 0.1 | 41 | value $7.1M, no tonnage | ||
| Kenya | <0.1 | 0.6 | 26 | 52 | ||
| Kuwait | <0.1 | 0.1 | 0.1 | |||
| Kyrgyzstan | 0.9 | 1.5 | ||||
| Lao People's Dem. Rep. | 116 | |||||
| Latvia | 29 | 22 | 117 | 111 | 205 | |
| Lebanon | 29 | 22 | ||||
| Liberia | <0.1 | |||||
| Lithuania | 44 | value $10.1M, no tonnage | 205 | 162 | 220 | |
| Luxembourg | 2.6 | 1.6 | 8.2 | 4 | ||
| Madagascar | 94 | 70 | value $1.5M, no tonnage | 0.2 | ||
| Malawi | 0.5 | 38 | 29 | |||
| Malaysia | 2.8 | 5.6 | 818 | 880 | 151 | |
| Maldives | <0.1 | |||||
| Mali | 6.6 | 2.8 | 63 | 30 | ||
| Malta | 0.1 | 0.1 | ||||
| Mauritania | 0.1 | <0.1 | ||||
| Mauritius | <0.1 | 0.8 | 2.8 | |||
| Mexico | 423 | 209 | 182 | |||
| Mongolia | value $0.1M, no tonnage | |||||
| Montenegro | <0.1 | <0.1 | ||||
| Montserrat | <0.1 | |||||
| Morocco | 0.5 | <0.1 | 82 | 137 | 193 | |
| Mozambique | 12 | 21 | 18 | 46 | ||
| Myanmar | 38 | 118 | 214 | |||
| Namibia | 0.7 | 14 | 12 | 26 | ||
| Netherlands | 279 | 382 | 163 | 307 | 333 | 138 |
| New Zealand | <0.1 | 146 | value $42.1M, no tonnage | |||
| Nicaragua | 0.4 | 40 | 42 | |||
| Nigeria | value $112.7M, no tonnage | 390 | 262 | |||
| North Macedonia | <0.1 | <0.1 | ||||
| Norway | 3.5 | 3.9 | ||||
| Oman | 1 | 1.8 | 1.9 | |||
| Other Asia, nes (Taiwan) | 238 | 140 | 200 | 6 | 8.3 | |
| Pakistan | 45 | 167 | 157 | |||
| Panama | 7.2 | 5.8 | ||||
| Papua New Guinea | 0.1 | 1.2 | ||||
| Paraguay | <0.1 | value $53.6M, no tonnage | value $49.6M, no tonnage | |||
| Peru | 0.9 | 0.7 | 294 | 355 | 194 | |
| Philippines | value $100.1M, no tonnage | value $102.6M, no tonnage | ||||
| Poland | 45 | 13 | 110 | 64 | ||
| Portugal | 2.2 | 1 | value $7.3M, no tonnage | 14 | ||
| Qatar | 0.1 | 0.2 | ||||
| Rep. of Korea | 165 | 107 | 172 | 69 | value $18.6M, no tonnage | |
| Rep. of Moldova | <0.1 | 0.2 | 22 | 14 | ||
| Romania | 22 | 9.7 | value $23.3M, no tonnage | 99 | ||
| Russian Federation | 262* | |||||
| Rwanda | <0.1 | <0.1 | ||||
| Sao Tome and Principe | 0.1 | 0.1 | ||||
| Saudi Arabia | 8.8 | 13 | ||||
| Senegal | <0.1 | 1 | 1.6 | |||
| Serbia | 24 | 56 | 15 | value $0.2M, no tonnage | ||
| Seychelles | <0.1 | <0.1 | ||||
| Singapore | value $5.8M, no tonnage | value $5.0M, no tonnage | value $2.4M, no tonnage | value $2.2M, no tonnage | ||
| Slovakia | 9.9 | <0.1 | 54 | 75 | ||
| Slovenia | <0.1 | <0.1 | 6.5 | 2.5 | ||
| South Africa | value $11.1M, no tonnage | 25 | 307 | 400 | 187 | |
| Spain | 163 | value $45.5M, no tonnage | value $34.1M, no tonnage | value $9.0M, no tonnage | ||
| Sri Lanka | value $13.6M, no tonnage | 65 | ||||
| State of Palestine | 2.7 | |||||
| Sweden | 0.5 | 0.5 | 1.1 | 1.4 | ||
| Switzerland | 0.1 | 0.3 | value $8.7M, no tonnage | value $6.1M, no tonnage | ||
| Tajikistan | 0.2 | |||||
| Thailand | 97 | 74 | 294 | value $80.5M, no tonnage | ||
| Timor-Leste | <0.1 | |||||
| Tonga | <0.1 | |||||
| Trinidad and Tobago | <0.1 | 0.2 | ||||
| Tunisia | 6.4 | 6.9 | ||||
| Türkiye | 75 | 56 | value $151.7M, no tonnage | value $150.7M, no tonnage | ||
| USA | 625 | 470 | 205 | 947 | 1,073 | 335 |
| Uganda | <0.1 | 1.7 | 1.9 | |||
| Ukraine | 281 | value $108.3M, no tonnage | ||||
| United Arab Emirates | 0.9 | value $0.6M, no tonnage | ||||
| United Kingdom | 1.3 | value $0.3M, no tonnage | value $43.3M, no tonnage | value $43.2M, no tonnage | ||
| United Rep. of Tanzania | <0.1 | 0.5 | 95 | 100 | 215 | |
| Uruguay | 0.3 | 1.1 | 90 | 87 | ||
| Uzbekistan | 14 | 5.7 | 0.1 | <0.1 | ||
| Viet Nam | 13 | 1,098 | ||||
| Yemen | 1.5 | |||||
| Zambia | 0.1 | 71 | value $18.3M, no tonnage | |||
| Zimbabwe | value $12.2M, no tonnage | 24 |
Sources: UN Comtrade, HS 310221 (ammonium sulphate), reporter data for 2023 and 2024, retrieved October 2026. Average values are reported value divided by reported weight (exports usually FOB, imports usually CIF), shown only for larger flows. Blank cells mean not reported. *Russia did not report 2024 trade; its export figure is the imports partner countries reported from Russia, a minimum.
Major producing and exporting countries
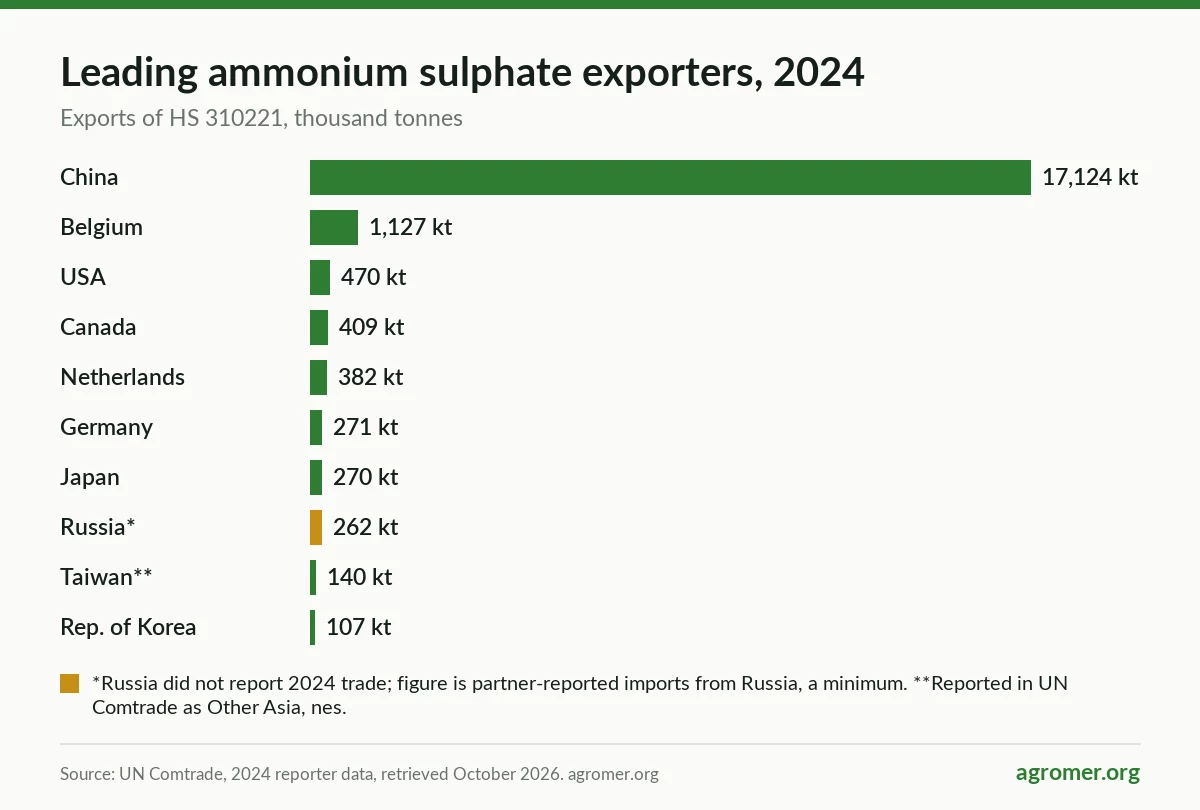
China exported 17.1 million tonnes of ammonium sulphate in 2024, according to UN Comtrade. That is more than 80% of all reported exports, at an average customs value of about $149 per tonne.
The next exporters are much smaller. Belgium exported 1.13 million tonnes, the United States 0.47 million, Canada 0.41 million and the Netherlands 0.38 million. Germany and Japan each exported about 0.27 million tonnes. Russia did not report its 2024 trade, but partner countries reported importing at least 0.26 million tonnes from it.
Average values vary a lot by origin. Canadian exports averaged about $369 per tonne and Belgian exports about $208. Product form is probably part of the reason, since granular material is worth more than standard crystals.
On the import side, Indonesia (1.10 million tonnes), the United States (1.07 million), Malaysia (0.88 million), India (0.55 million), Australia (0.45 million), South Africa (0.40 million) and Nigeria (0.39 million) were the largest reporting buyers in 2024. Brazil, a very large buyer, reported the value of its 2024 imports ($1.08 billion) but not the tonnage. In 2023 it reported 5.1 million tonnes.
Shipping, packaging and storage
Ammonium sulphate moves in bulk vessels, in big bags and in 25 or 50 kg bags. A few points need attention:
- Caking: the product can cake in humid conditions. Ask about anti-caking treatment and moisture limits.
- Free acidity: residual acid can corrode equipment and damage bags. Agree a maximum.
- Mixing: it should not be stored or blended carelessly with incompatible products. Check compatibility before blending.
- Particle size: confirm the size range in the contract and at inspection, especially for granular material.
Standard documents include the commercial invoice, bill of lading, certificate of origin, certificate of analysis and an independent inspection certificate.
What to check before you buy
- Grade and form: granular, compacted or crystalline, and agricultural, industrial or food grade.
- Specification: nitrogen and sulphur content, moisture, free acidity, particle size and colour.
- Source: caprolactam, coke-oven or synthetic, since it can affect impurities and appearance.
- Producer and plant: ask who makes it and where it will load.
- Volume and timing: by-product supply can be seasonal or tied to other markets.
- Minimum quantities and packaging: confirm these with each supplier.
- Incoterms and freight: freight is a large share of the delivered cost of a low-value product.
- Payment: a documentary letter of credit or SBLC for bulk cargoes.
- Import rules: registration and labelling in your country.
- Inspection: independent quality and weight checks at loading.
Our guide to requesting a bulk commodity quotation shows how to set out an enquiry.
Why an ammonium sulphate database helps
- See how concentrated supply is, and which alternatives to China exist.
- Check that a named producer actually makes ammonium sulphate.
- Compare average trade values between origins and grades.
- Understand the by-product sources behind different offers.
- Send precise enquiries that suppliers can price quickly.
Sourcing enquiries through Agromer
Agromer has been an international commodity trader since 1985, based in Saint-Avertin, France. Our main fertilizer range is urea, NPK, potash and DAP, along with organic products. Ammonium sulphate is not one of our standard lines, but you can send a sourcing enquiry with the grade, quantity, packaging and destination, and we will tell you plainly whether we can help. For nitrogen alternatives, see nitrogen fertilizer and urea fertilizer.
Frequently asked questions
Which country exports the most ammonium sulphate?
China, by a wide margin. It exported 17.1 million tonnes in 2024, more than 80% of all reported exports, according to UN Comtrade.
What is the difference between granular and crystalline ammonium sulphate?
Granular ammonium sulphate has larger, harder particles that blend and spread well. Crystalline (standard) material is finer, cheaper, and suited to direct application, NPK plants or dissolving.
What is the nutrient content of ammonium sulphate?
About 21% nitrogen and 24% sulphur. The nitrogen is in ammonium form.
Why is ammonium sulphate called a by-product?
A large share is produced while making other chemicals, mainly caprolactam for nylon 6, or recovered from coke-oven gas at steel plants. Some is made directly from ammonia and sulphuric acid.
Who are the main ammonium sulphate manufacturers?
Producers include AdvanSix in the United States, Fibrant in the Netherlands, GSFC and FACT in India, Petrokimia Gresik in Indonesia and KuibyshevAzot in Russia, along with many Chinese producers.
Is ammonium sulphate better than urea?
They do different jobs. Urea carries far more nitrogen per tonne (46%), so it is usually cheaper per unit of nitrogen. Ammonium sulphate adds sulphur and has an acidifying effect. Many farmers use both.
Can I download the ammonium sulphate suppliers list?
Yes. Use the Download CSV button above either table to save what you see, including the sources.