Almost every bulk phosphate deal in the world comes down to two products: DAP and MAP. Both are ammonium phosphates. Both start as phosphate rock. Yet they suit different crops, different markets and different blending plants, and the list of countries that can export them in volume is short.
This page brings together what buyers need when they look for DAP fertilizer suppliers worldwide: a verified sample of DAP and MAP producers, 2024 trade data by country, the main grades, price benchmarks, and a practical sourcing checklist. Both tables can be searched and downloaded.
To be clear from the start: this is a research resource we build and check one record at a time. It is not a full directory of phosphate fertilizer manufacturers, and it only includes details we have confirmed.
How the global phosphate fertilizer industry works
Phosphate fertilizer has a simple chain with very few entry points.
- Phosphate rock is mined. The U.S. Geological Survey estimates world output at about 250 million tonnes in 2025, led by China (110 million), Morocco (36 million), the United States (20 million), Russia (14 million), Jordan (12 million) and Saudi Arabia (10 million).
- Phosphoric acid is made by treating the rock with sulphuric acid. This is why phosphate plants often sit next to sulphur supplies or sulphuric acid plants.
- DAP and MAP are made by reacting phosphoric acid with ammonia, then granulating the product.
Reserves are even more concentrated than production. Of the 73 billion tonnes of phosphate rock reserves the USGS lists worldwide, Morocco holds about 50 billion. For buyers, that means Moroccan supply shapes the market for decades, not just for a season.
Demand keeps growing slowly. The USGS puts world consumption of P2O5 in fertilizers at 47.8 million tonnes in 2025, rising to a projected 51.5 million tonnes by 2029, with Asia and South America leading.

DAP vs MAP: what is the difference?
The difference is how much ammonia goes into the reaction. DAP uses more, so it carries more nitrogen and slightly less phosphate. MAP uses less.

| DAP | MAP | |
|---|---|---|
| Chemical name | Diammonium phosphate | Monoammonium phosphate |
| Typical grade | 18-46-0 | 11-52-0 (also 10-50-0 and others) |
| Soil reaction around the granule | Slightly alkaline | Slightly acidic |
| Common uses | Direct application and blends, especially in South Asia | Blending and direct application, widely used in the Americas |
| Main 2024 exporters | Morocco, China, Saudi Arabia | Morocco, China, USA, Saudi Arabia, Russia |
| Main 2024 importers | India, USA, Pakistan | Brazil, Canada, Australia, USA |
Other phosphate products often sit in the same tender. TSP (0-46-0) carries phosphate with no nitrogen. Water-soluble MAP (12-61-0) is a purified grade for fertigation, priced well above granular MAP. And some buyers ask for NPS or other sulphur-enriched grades, which are specified separately.
For more on DAP itself, see our DAP fertilizer page.
Search the DAP and MAP suppliers database
The table lists phosphate fertilizer manufacturers we confirmed in October 2026, on their official websites or, where a website blocks automated checks, on Wikipedia. The “Products confirmed” column shows only what that source says. Search by company or country, filter by region, sort, or download as CSV.
| Company | Country | Region | Products confirmed | Country DAP exports 2024 (kt) | Official website | Verified via (Oct 2026) |
|---|---|---|---|---|---|---|
| Coromandel International | India | South Asia | DAP, complex fertilizers, SSP | 73 | coromandel.biz | Official website |
| Gujarat State Fertilizers & Chemicals (GSFC) | India | South Asia | DAP, NPK, ammonium sulphate | 73 | gsfclimited.com | Official website |
| IFFCO | India | South Asia | DAP | 73 | iffco.in | Official website |
| Paradeep Phosphates | India | South Asia | DAP, NPK | 73 | paradeepphosphates.com | Official website |
| Jordan Phosphate Mines Company (JPMC) | Jordan | Middle East | Phosphate rock, phosphoric acid, DAP | 192 | jpmc.com.jo | Official website |
| Lifosa (EuroChem) | Lithuania | Europe | DAP, MAP, phosphoric acid | 132 | lifosa.com | Wikipedia |
| OCP Group | Morocco | North Africa | DAP, MAP, TSP, NPK | 7,831 | ocpgroup.ma | Wikipedia |
| PhosAgro | Russia | Europe and Central Asia | DAP, NPK | 1,236* | phosagro.com | Official website · check sanctions |
| Foskor | South Africa | Sub-Saharan Africa | Phosphoric acid, MAP | 0 | foskor.co.za | Official website |
| The Mosaic Company | United States | North America | Phosphate, potash | 375 | mosaicco.com | Wikipedia |
DAP and MAP producers we confirmed in October 2026, on the company's official website or, where the website blocks automated checks, on Wikipedia (linked in the last column). "Products confirmed" lists only what that source states. This is a verified sample, not a complete list, and inclusion does not mean Agromer represents the company. Russian and Belarusian producers: check the sanctions rules that apply to you. Country export figures: UN Comtrade, HS 310530 (DAP) and HS 310540 (MAP), 2024; blank means not reported. *Russia did not report 2024 trade; its DAP and MAP export figures are the imports partner countries reported from Russia, a minimum.
DAP and MAP trade by country, 2024
This table covers every country that reported DAP or MAP trade, plus USGS phosphate rock production. Filter to exporters to see realistic origins.
| Country | DAP exports 2024 (kt) | MAP exports 2024 (kt) | Avg DAP export value 2024 ($/t) | DAP imports 2024 (kt) | MAP imports 2024 (kt) | Avg DAP import value 2024 ($/t) | Phosphate rock 2025e (kt) |
|---|---|---|---|---|---|---|---|
| Albania | 9 | ||||||
| Algeria | 0.1 | 89 | 2,000 | ||||
| Angola | 4.5 | 9.3 | |||||
| Antigua and Barbuda | <0.1 | ||||||
| Argentina | 281 | 768 | 611 | ||||
| Armenia | <0.1 | <0.1 | 0.4 | ||||
| Australia | 407 | value $0.2M, no tonnage | 567 | 253 | 1,481 | 638 | 2,500 |
| Austria | 2.3 | 0.3 | 35 | 0.5 | |||
| Azerbaijan | <0.1 | value $18.2M, no tonnage | |||||
| Bahamas | 0.1 | <0.1 | |||||
| Bahrain | <0.1 | <0.1 | |||||
| Barbados | <0.1 | ||||||
| Belgium | 60 | 60 | 46 | 31 | |||
| Belize | 9.6 | 0.1 | |||||
| Benin | |||||||
| Bhutan | |||||||
| Bolivia (Plurinational State of) | 22 | 26 | |||||
| Bosnia Herzegovina | <0.1 | value $0.4M, no tonnage | |||||
| Botswana | <0.1 | <0.1 | |||||
| Brazil | 6 | 198 | 4,211 | 584 | 5,000 | ||
| Bulgaria | 25 | 110 | 64 | 28 | |||
| Burkina Faso | <0.1 | <0.1 | |||||
| Burundi | |||||||
| Cabo Verde | <0.1 | ||||||
| Cambodia | 43 | 1.7 | |||||
| Cameroon | |||||||
| Canada | 8.6 | 16 | 146 | 1,778 | 609 | ||
| Cayman Isds | <0.1 | <0.1 | |||||
| Chile | <0.1 | 0.1 | 17 | value $116.6M, no tonnage | |||
| China | 4,562 | 2,005 | 558 | value $0.3M, no tonnage | 15 | 110,000 | |
| China, Hong Kong SAR | <0.1 | <0.1 | <0.1 | ||||
| Colombia | 0.2 | 1.5 | 143 | value $115.1M, no tonnage | 634 | ||
| Congo | 0.5 | 0.1 | |||||
| Costa Rica | 0.5 | 31 | 4.1 | ||||
| Croatia | <0.1 | <0.1 | 12 | 19 | |||
| Cyprus | <0.1 | <0.1 | |||||
| Czechia | <0.1 | 1.2 | value $1.3M, no tonnage | 39 | |||
| Côte d'Ivoire | 0.9 | <0.1 | 31 | <0.1 | |||
| Dem. Rep. of the Congo | 0.2 | ||||||
| Denmark | <0.1 | 0.1 | 16 | 0.7 | |||
| Djibouti | |||||||
| Dominican Rep. | 16 | 11 | |||||
| Ecuador | 0.1 | 94 | 12 | ||||
| Egypt | 83 | 138 | 0.3 | 8.5 | 5,500 | ||
| El Salvador | 2.3 | 23 | 0.1 | ||||
| Estonia | <0.1 | <0.1 | 0.3 | value $1.5M, no tonnage | |||
| Eswatini | |||||||
| Ethiopia | |||||||
| Fiji | 2 | ||||||
| Finland | <0.1 | 39 | 0.1 | 1.2 | 980 | ||
| France | 13 | 8.2 | 335 | 40 | 612 | ||
| Gabon | |||||||
| Georgia | 0.5 | 2.5 | |||||
| Germany | 18 | 29 | 250 | 46 | 629 | ||
| Ghana | 2.9 | 0.4 | |||||
| Greece | 0.1 | 0.3 | 17 | 26 | |||
| Grenada | <0.1 | <0.1 | |||||
| Guatemala | 2.6 | 0.2 | 95 | 3.6 | |||
| Guyana | <0.1 | <0.1 | |||||
| Honduras | 9.9 | 0.3 | 90 | 2.1 | |||
| Hungary | 1.3 | 1.7 | value $19.0M, no tonnage | 43 | |||
| Iceland | <0.1 | ||||||
| India | 73 | 0.2 | 4,622 | 167 | 596 | 1,500 | |
| Indonesia | <0.1 | 295 | 58 | 588 | |||
| Iran | |||||||
| Iraq | 4.2 | 15 | |||||
| Ireland | 0.5 | 104 | 4.5 | 653 | |||
| Israel | 8.9 | <0.1 | 36 | 2,400 | |||
| Italy | 36 | value $11.6M, no tonnage | 211 | 118 | 631 | ||
| Jamaica | 4.1 | 0.4 | |||||
| Japan | <0.1 | <0.1 | 326 | 90 | 642 | ||
| Jordan | 192 | 52 | 647 | 2.5 | 9 | 12,000 | |
| Kazakhstan | 0.6 | 0.1 | value $5.0M, no tonnage | 1,900 | |||
| Kenya | 8.8 | 0.2 | 136 | 8.4 | 602 | ||
| Kuwait | 0.1 | 0.4 | |||||
| Kyrgyzstan | <0.1 | <0.1 | <0.1 | ||||
| Lao People's Dem. Rep. | |||||||
| Latvia | <0.1 | 12 | 15 | 36 | |||
| Lebanon | 1.3 | 1.9 | |||||
| Lithuania | 132 | 119 | 615 | 70 | 37 | ||
| Luxembourg | 0.9 | 1.4 | <0.1 | ||||
| Madagascar | 3.7 | 0.4 | |||||
| Malawi | 8.2 | 1.3 | |||||
| Malaysia | 4.9 | 2.9 | 77 | 94 | |||
| Maldives | <0.1 | <0.1 | |||||
| Mali | 9.5 | 21 | 32 | ||||
| Malta | <0.1 | <0.1 | |||||
| Mauritania | <0.1 | 0.2 | |||||
| Mauritius | <0.1 | 0.4 | 0.4 | ||||
| Mexico | 14 | 172 | 410 | 103 | 605 | 450 | |
| Mongolia | |||||||
| Montenegro | <0.1 | ||||||
| Morocco | 7,831 | 7,524 | 526 | <0.1 | 0.1 | 36,000 | |
| Mozambique | 12 | 0.7 | 51 | 2.2 | |||
| Myanmar | 30 | 10 | |||||
| Namibia | 11 | 34 | 18 | 45 | |||
| Netherlands | 9.4 | 26 | 31 | value $35.1M, no tonnage | |||
| New Zealand | 195 | value $0.6M, no tonnage | 648 | ||||
| Nicaragua | 40 | 5.1 | |||||
| Niger | <0.1 | <0.1 | |||||
| Nigeria | value $74.2M, no tonnage | 0.1 | |||||
| North Macedonia | <0.1 | 0.5 | 0.4 | ||||
| Norway | 10 | <0.1 | 23 | ||||
| Oman | 1.2 | 0.1 | |||||
| Other Asia, nes (Taiwan) | <0.1 | <0.1 | 1.8 | 19 | |||
| Pakistan | 971 | 8 | 620 | ||||
| Panama | 0.1 | 13 | 1.1 | ||||
| Papua New Guinea | 2.7 | <0.1 | |||||
| Paraguay | 1.2 | value $16.0M, no tonnage | 242 | ||||
| Peru | 7.8 | 19 | 185 | 43 | 626 | 4,800 | |
| Philippines | <0.1 | 137 | 2.2 | 618 | |||
| Poland | 30 | 40 | 206 | 100 | 616 | ||
| Portugal | 16 | 15 | 23 | 13 | |||
| Qatar | 0.1 | <0.1 | |||||
| Rep. of Korea | 30 | 38 | 86 | value $3.0M, no tonnage | |||
| Rep. of Moldova | 0.3 | 1 | |||||
| Romania | 13 | 1.5 | 144 | 22 | 576 | ||
| Russian Federation | 1,236* | 3,109* | 14,000 | ||||
| Rwanda | 0.1 | 33 | <0.1 | ||||
| Saudi Arabia | 3,902 | 1,424 | 591 | 0.2 | 4.6 | 10,000 | |
| Senegal | 0.9 | value $24.8M, no tonnage | 11 | 1.4 | 2,800 | ||
| Serbia | <0.1 | 8.5 | <0.1 | 42 | |||
| Seychelles | <0.1 | ||||||
| Singapore | <0.1 | value $0.5M, no tonnage | <0.1 | <0.1 | |||
| Slovakia | 0.7 | 1.3 | 11 | ||||
| Slovenia | 5 | 6.7 | 39 | 66 | |||
| South Africa | 0.1 | 83 | 0.5 | 352 | 2,200 | ||
| Spain | 6.9 | 93 | 181 | 119 | 638 | ||
| Sri Lanka | 1.5 | 0.1 | |||||
| Suriname | <0.1 | ||||||
| Sweden | <0.1 | 0.2 | 0.1 | 13 | |||
| Switzerland | <0.1 | <0.1 | 4.2 | 0.8 | |||
| Syria | 800 | ||||||
| Tajikistan | |||||||
| Thailand | 3.3 | 17 | 4.8 | 4.3 | |||
| Timor-Leste | |||||||
| Togo | <0.1 | 1,600 | |||||
| Trinidad and Tobago | 0.1 | ||||||
| Tunisia | 224 | 28 | 661 | 0.4 | 2 | 3,300 | |
| Türkiye | 172 | 11 | 604 | 404 | 69 | 609 | 1,200 |
| USA | 375 | 1,852 | 532 | 1,262 | 1,084 | 594 | 20,000 |
| Uganda | 6.7 | <0.1 | |||||
| Ukraine | 69 | 105 | |||||
| United Arab Emirates | |||||||
| United Kingdom | 0.3 | 0.4 | 96 | 16 | |||
| United Rep. of Tanzania | value $20.4M, no tonnage | 111 | <0.1 | 607 | |||
| Uruguay | 0.6 | 1.5 | 46 | 75 | |||
| Uzbekistan | 55 | 57 | 7.9 | 950 | |||
| Viet Nam | 3,000 | ||||||
| Zambia | 8.4 | 41 | 104 | ||||
| Zimbabwe | 18 | 75 |
Sources: UN Comtrade, HS 310530 (DAP) and HS 310540 (MAP), reporter data for 2023 and 2024, retrieved October 2026; U.S. Geological Survey, Mineral Commodity Summaries 2026 (marketable phosphate rock, 2025 estimates). Average values are reported value divided by reported weight (exports usually FOB, imports usually CIF), shown only for larger flows. Blank cells mean not reported. *Russia did not report 2024 trade; its DAP and MAP export figures are the imports partner countries reported from Russia, a minimum.
Major producing and exporting countries
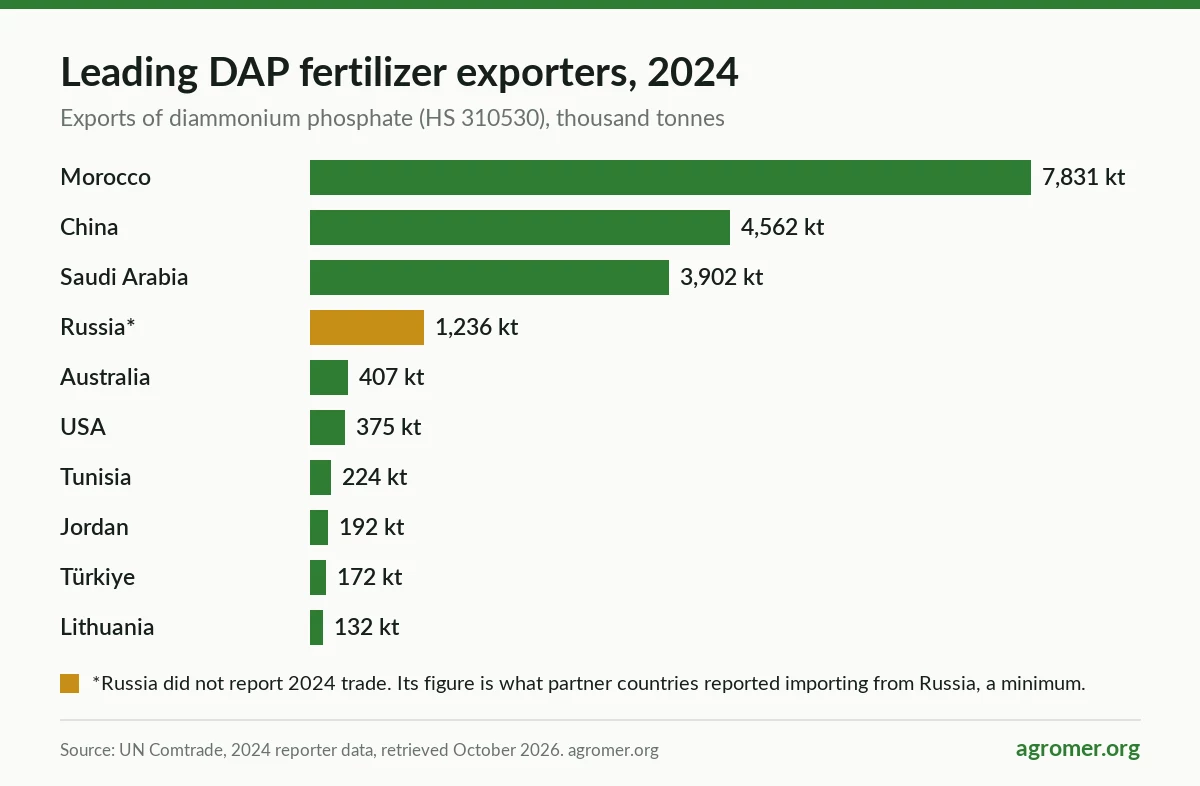
Morocco is in a category of its own. It exported 7.83 million tonnes of DAP and 7.52 million tonnes of MAP in 2024, more than any other country for both products. OCP Group runs the mines, acid plants and granulation units.
China exported 4.56 million tonnes of DAP and 2.01 million tonnes of MAP. It is also by far the largest producer of phosphate rock, but most of its output stays at home, and its exports have been subject to government controls in recent years. Volumes can change quickly.
Saudi Arabia exported 3.90 million tonnes of DAP and 1.42 million tonnes of MAP from its integrated phosphate complexes on the Gulf coast.
Russia did not report its 2024 trade. Partner countries reported importing at least 1.24 million tonnes of Russian DAP and 3.11 million tonnes of MAP. Buyers need to check the sanctions rules that apply to them, their banks and their vessels.
The United States exported 1.85 million tonnes of MAP, yet it also imported 1.26 million tonnes of DAP and 1.08 million tonnes of MAP. That two-way trade is common: the producing region is not always where the demand is.
Jordan, Tunisia, Egypt and Australia are smaller exporters, each with its own phosphate rock.
On the buying side, India imported 4.62 million tonnes of DAP in 2024, more than a third of all reported DAP imports, and Brazil imported 4.21 million tonnes of MAP.
Prices: what the benchmarks say
The World Bank publishes a monthly DAP benchmark, quoted FOB US Gulf.
| Period | DAP, $ per tonne | Phosphate rock, $ per tonne |
|---|---|---|
| 2023 average | 550.0 | 321.7 |
| 2024 average | 563.7 | 152.5 |
| 2025 average | 685.2 | 152.5 |
| July to September 2026 | 791.8 | 170.0 |
| September 2026 | 800.6 | 170.0 |
Customs data gives a second view. In 2024, the average export value of DAP was about $526 per tonne for Morocco, $558 for China and $591 for Saudi Arabia, and India’s average import value was about $596. These are annual averages across all contracts, not quotes. For today’s price, you need a firm offer with the specification, quantity, port and shipment date.
Who sells DAP and MAP
The phosphate market has fewer producers than nitrogen, and a large share of trade runs through long-term contracts, government tenders and the producers’ own sales networks.
- Producers sell directly to large importers, governments and blenders, often on term contracts.
- Trading houses buy cargoes and resell them, taking care of freight, finance and documents.
- Importers and distributors bag, store and sell to retailers and cooperatives.
A medium-sized importer in East Africa, for instance, may not qualify for a producer’s term contract. Buying through a trader that already holds a supply agreement is often the practical route. The key is to know which producer stands behind the cargo.
Packaging, shipping and documentation
- Bulk vessels, from handysize to supramax, for large importers.
- Big bags for ports without bagging facilities.
- 50 kg bags, often in containers, for smaller orders.
Ask about granule size, hardness and dust, because phosphate granules can break down in long voyages and repeated handling. Agree the inspection company and the point of inspection before shipment. Standard documents include the commercial invoice, bill of lading, certificate of origin, certificate of analysis and the inspection certificate.
Checklist for buyers of bulk DAP and MAP
- Grade: total N and P2O5, water-soluble P2O5, moisture and granule size.
- Origin and plant: ask the seller to name the producer and loading port.
- Contaminants: cadmium and other heavy metals, where your market sets limits.
- Quantity and schedule: realistic for the producer’s export programme.
- Minimum quantities: these depend on the supplier and shipping route, so confirm them.
- Packaging: bulk, big bags or 50 kg bags, and the marking your country requires.
- Price basis and Incoterms: FOB, CFR or CIF, and the discharge port.
- Payment: a documentary letter of credit or SBLC.
- Sanctions screening: for the company, its banks, its owners and the vessel.
- Inspection: independent quality and weight inspection at loading.
See how to verify an international commodity supplier for a step-by-step approach.
How a phosphate supplier database helps
Used well, a DAP and MAP database lets you:
- Narrow the field to countries that actually export the product you need.
- Check that a named producer really makes DAP or MAP.
- Compare average trade values between origins.
- Read the market before tenders and price talks.
- Write a complete enquiry, which gets faster and better answers.
Buying DAP through Agromer
Agromer has traded international commodities since 1985 from Saint-Avertin, France, and DAP is one of the fertilizers we supply. Each offer is matched to your specification, quantity and destination. Terms are written into a sales and purchase agreement, with payment by 100% DLC or SBLC and independent SGS inspection where required. Availability, origin and price depend on the market when you enquire.
Frequently asked questions
What is the difference between DAP and MAP fertilizer?
DAP (18-46-0) contains more nitrogen and slightly less phosphate than MAP (11-52-0). DAP is slightly alkaline around the granule, while MAP is slightly acidic.
Which countries export the most DAP?
In 2024, Morocco exported 7.83 million tonnes, China 4.56 million and Saudi Arabia 3.90 million, according to UN Comtrade. Russia exported at least 1.24 million tonnes based on partner data.
Which countries import the most DAP and MAP?
India was the largest DAP importer in 2024 with 4.62 million tonnes. Brazil led MAP imports with 4.21 million tonnes, followed by Canada and Australia.
Who are the main DAP manufacturers?
Large producers include OCP Group in Morocco, PhosAgro in Russia, The Mosaic Company in the United States, EuroChem’s Lifosa plant in Lithuania, and Indian producers such as IFFCO, Coromandel and Paradeep Phosphates.
What is the current DAP price?
The World Bank DAP benchmark averaged $800.6 per tonne FOB US Gulf in September 2026. Delivered prices depend on origin, freight, quantity and payment terms.
Is MAP better than DAP?
Neither is better in general. MAP gives more phosphate per tonne and suits soils where a slightly acidic reaction helps. DAP carries more nitrogen. The right choice depends on the crop, the soil and the price of each at the time you buy.
Can I download the DAP and MAP suppliers list?
Yes. Use the Download CSV button above either table. It saves the rows you see, with the source note.